A Taste of D3
Why, What's Possible, and... How!
Created by Eugene Chen / @ideaOwl, Darkhorse Analytics
Why?
Cool shit
Another Reason...
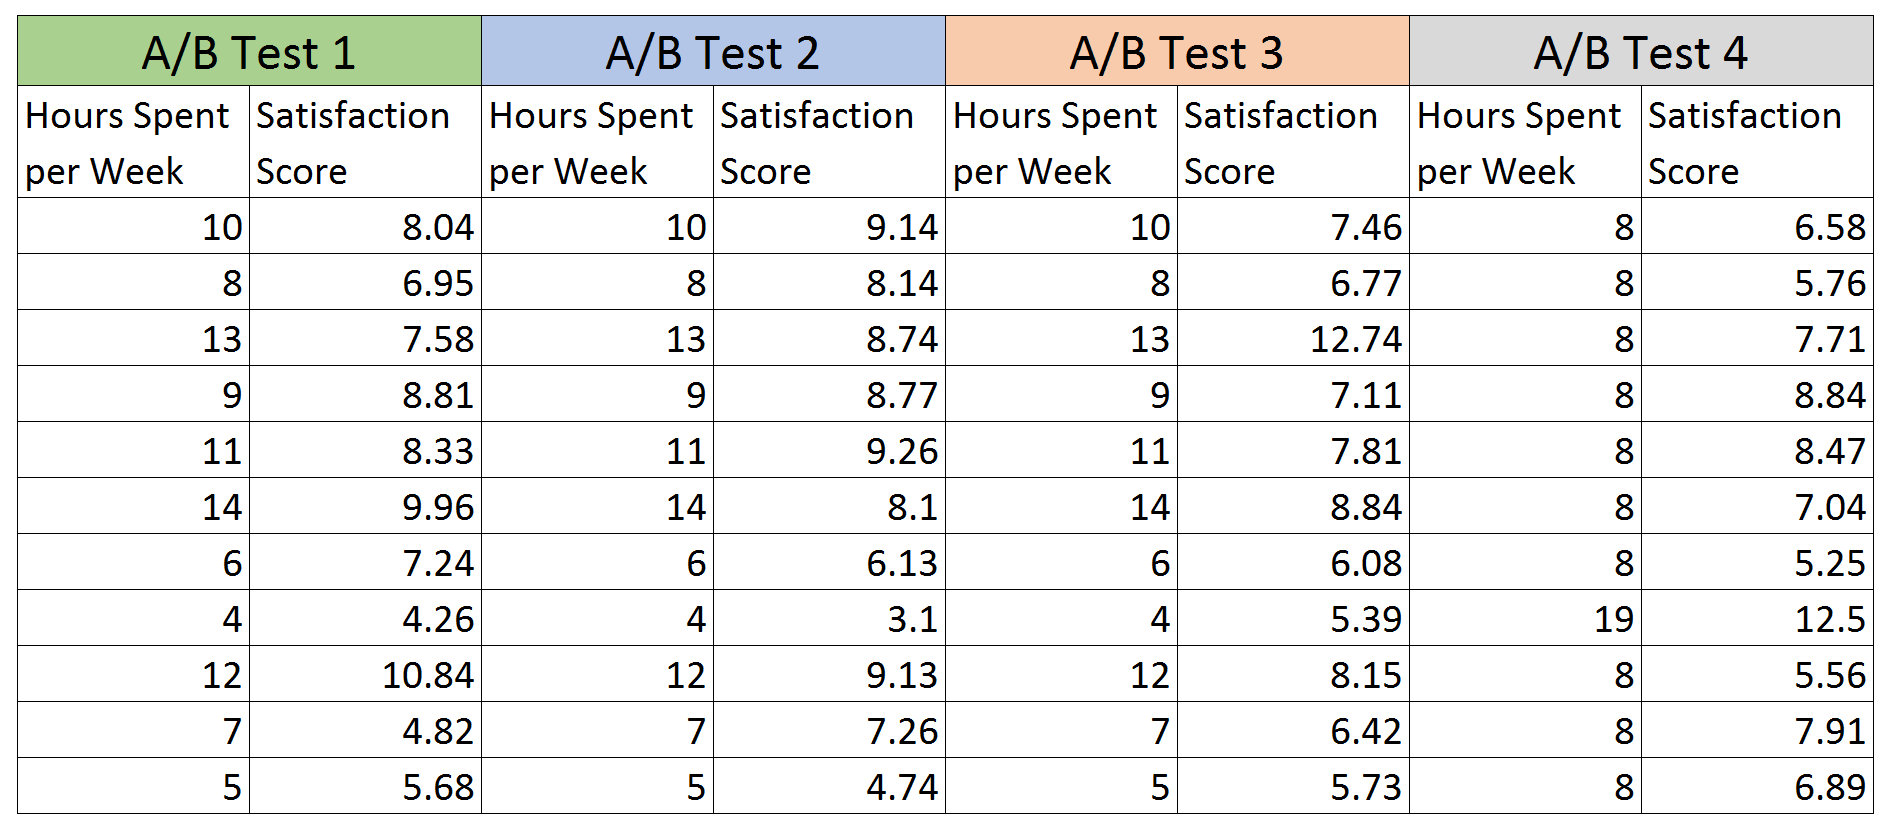
Summarizing the Data
| Item | Avg Hours | Avg Score | Correlation |
|---|---|---|---|
| A/B Test #1 | 9 | 7.5 | 0.816 |
| A/B Test #2 | 9 | 7.5 | 0.816 |
| A/B Test #3 | 9 | 7.5 | 0.816 |
| A/B Test #4 | 9 | 7.5 | 0.816 |
Visualizing the Data

Data isn't Good Enough
- Data
- Deriving Insights
- Communicating Insights
- Believable
- Memorable
- (Actionable)
- Engaging
All about the Visualizing
But why use D3?
What's Possible
Let's Code in D3!
(With Bar Charts)
You're already familiar
jQuery
$("#mainImage")
  .attr("alt", "Earth")
  .css("border", "5px solid red")
  .addClass("important")
  .on("click", function(){
    alert("70% Water");
  })
d3
d3.select("#mainImage")
  .attr("alt", "Earth")
  .style("border", "5px solid red")
  .classed("important", true)
  .on("click", function(){
    alert("70% Water");
  })
SVG: Why D3 Looks Amazing

"Naked" SVG
The SVG Code
<svg width="400px" height="300px">

  <circle cx="100" cy="100" r="90"
          stroke="white"
          stroke-width="3"
          fill="red" />

  <rect x="50" y="150" width="300"
        height="100"
        style="fill:blue;" />

</svg>
The Image
A "Row" in Bar Chart
The SVG Code
<svg width="400px" height="400px">

  <text y="24"
    class="title">Banana</text>

  <rect x="120" height="30"
    width="200"
    style="fill:blue;" />

  <text y="20" x="330"
    class="value">200</text>

</svg>
The SVG
Recreating with Javascript
The SVG Code
<svg width="400px" height="400px">

  <text y="24"
    class="title">Banana</text>

  <rect x="120" height="30"
    width="200"
    style="fill:blue;" />

  <text y="20" x="330"
    class="value">200</text>

</svg>
Javascript
var sbox = d3.select("#sandbox");
var svg =
    sbox.append("svg")
        .attr("width", "400px")
        .attr("height", "400px");

var title = svg.append("text")
   ...

var rect = svg.append("rect")
   ...

var valueLabel = svg.append("text")
   ...
D3 Drew Stuff!
... But what about using data?
D3: Excel to Data to JS

Adding Data To Draw
Javascript
var myData =
  [{title: "Banana", v: 200},
   {title: "Apple",  v: 120},
   {title: "Cherry", v: 220},
   {title: "Pear",   v: 30},
   {title: "Grapes", v: 60},
   {title: "Orange", v: 120},
   {title: "Mango",  v: 110}];

var sbox = ...
var svg = ...

...
The SVG
A color transition
Javascript
...

var rect = row
   .append("rect")
   .attr("x", "120")
   .attr("height", "30")
   .attr("width", function(d){
     return d.v;})
   .style("fill", "blue")
   .transition()
   .duration(2000)
   .style("fill", "red");

...
The SVG
Using Index and Delay
Javascript
...

var rect = row
   .append("rect")
   .attr("x", "120")
   .attr("height", "30")
   .attr("width", function(d){
     return d.v;})
   .style("fill", "blue")
   .transition()
   .duration(2000)
   .delay(function(d,i){
     return i * 100;})
   .style("fill", "red");

...
The SVG
Positioning Rows
Javascript
...
var row = svg
   .selectAll("g")
   .data(myData)
   .enter()
   .append("g")
   .attr("transform",
     "translate(0, 500)");

row
   .transition()
   .duration(2000)
   .delay(function(d,i){
     return i * 100;})
   .attr("transform", function(d,i){
     return "translate(0 "+i*40+")";
     });
...
The SVG
Updating & Removing

Updating the Data
Javascript
var myData =
  [{title: "Banana", v: 200},
   {title: "Apple",  v: 120},
   {title: "Cherry", v: 220},
   {title: "Pear",   v: 30},
   {title: "Grapes", v: 60},
   {title: "Orange", v: 120},
   {title: "Mango",  v: 110}];

var newData =
  [{title: "Banana", v: 100},
   {title: "Apple",  v: 150},
   {title: "Cherry", v: 10},
   {title: "Pear",   v: 230},
   {title: "Grapes", v: 30},
   {title: "Orange", v: 10},
   {title: "Mango",  v: 210},
   {title: "Durian", v: 40}];
The SVG
Resorting
Javascript
var myData =
  [{title: "Banana", v: 200},
   ...];

var newData =
  [{title: "Banana", v: 100},
   ...];

button.on("click", function(){
   draw(newData
   .sort(function(a, b){
   return b.v-a.v}));
})

   ...
The SVG
Missing, or "Exited" Data
Javascript
var myData =
  [{title: "Banana", v: 200},
   ...];

var newData =
  [{title: "Banana", v: 100},
   {title: "Apple",  v: 150},
   ...];

   ...

var rowExit = row
   .exit() // if no longer exists
   .transition()
   .duration(2000)
   .attr("transform",
	 "translate(500, 0)")
   .remove();
The SVG
Enter-Update-Exit Dance
Javascript
...

button.on("click", function(){

   // Randomly pick, with odds and
   // range, fruits and values for
   // dataSubset
   ...

   draw(dataSubset
     .sort(function(a, b){
     return b.v-a.v}));
})

...
The SVG
What we covered
- Visualizing Data
- Overview of D3
- SVG (Graphics!)
- Bar Chart
- Enter + Transitions, Update and Exit